Data Analyst Resume Sample: Analytics Resume Example for 2026
Complete guide · 15 min read · Updated 2026
Analytics hiring has a specific failure mode, and almost every rejected resume shares it. The candidate describes what they built, the reader cannot tell what anybody did differently afterwards, and the application ends there. Dashboards are not outcomes. The decision the dashboard changed is the outcome.
Below is a complete data analyst resume, annotated section by section, with what changes for product, marketing, BI and analytics engineering roles, for career changers, and for the SQL screen that follows the resume. The sample is a senior analyst five years in, working in SQL, Python and dbt.
Choosing your template
An analytics resume lives or dies on two things a layout can wreck: a dense tool list that has to survive keyword matching intact, and bullets long enough to carry a result without wrapping into mush. A single-column layout keeps the tool groups readable and their labels attached. Sidebar templates are where a skills block gets read out of order, which matters more here than in most fields, because the first filter on an analytics application is frequently a literal search for a tool name.
Browse all 20 templates →Section-by-section: what to write
Header and title line
Name, then the title you hold or are targeting directly beneath it. Then city, phone, email, and links. Analyst titles vary wildly between companies, so the title line is doing real disambiguation: "Senior Data Analyst" and "Analytics Engineer" are screened by different people against different lists.
Professional summary
Three lines: years and the kind of business, the stack you actually work in, and one result somebody outside the data team would recognise. Naming the domain matters more than analysts expect. Marketplace, subscription, healthcare and fintech analytics differ enough that hiring managers screen on it, and it explains which metrics you already understand.
Portfolio and links
GitHub, a portfolio site, or a public dashboard, in the contact line where they are found. Only link something you would happily walk through in an interview: an abandoned repo of tutorial notebooks is worse than no link. If your best work is under NDA, say so and link a small clean project instead.
Experience: the decision, not the dashboard
Employer, title, dates, and the scale you worked at: company size, data volume, who you supported. Then, for each bullet, finish the sentence that most analysts leave hanging. Not "built a retention dashboard" but what the dashboard revealed and what the business did next. If nothing changed, pick a different bullet.
Skills, named exactly
Group them so a reader can scan: languages and tools, analysis methods, visualisation, data platform. Then name each thing precisely, including the SQL dialect and warehouse. "Snowflake", "BigQuery", "dbt", "Looker" and "Power BI" are searched literally, and "data tools" or "BI software" matches nothing anybody types.
Education
Degree, school, year. A quantitative degree is worth naming plainly (statistics, economics, mathematics, engineering) because it answers a question about your grounding. If your degree is unrelated, keep the section to one line and let the experience and projects carry the argument.
Certifications, and which ones count
Vendor certifications for the tools you actually use carry some weight: dbt, Snowflake, Tableau, Power BI, the cloud platforms. Course completion certificates carry very little, and a wall of them reads as substitute for experience. Three real ones beat twelve of anything.
Data Analyst resume sample, annotated
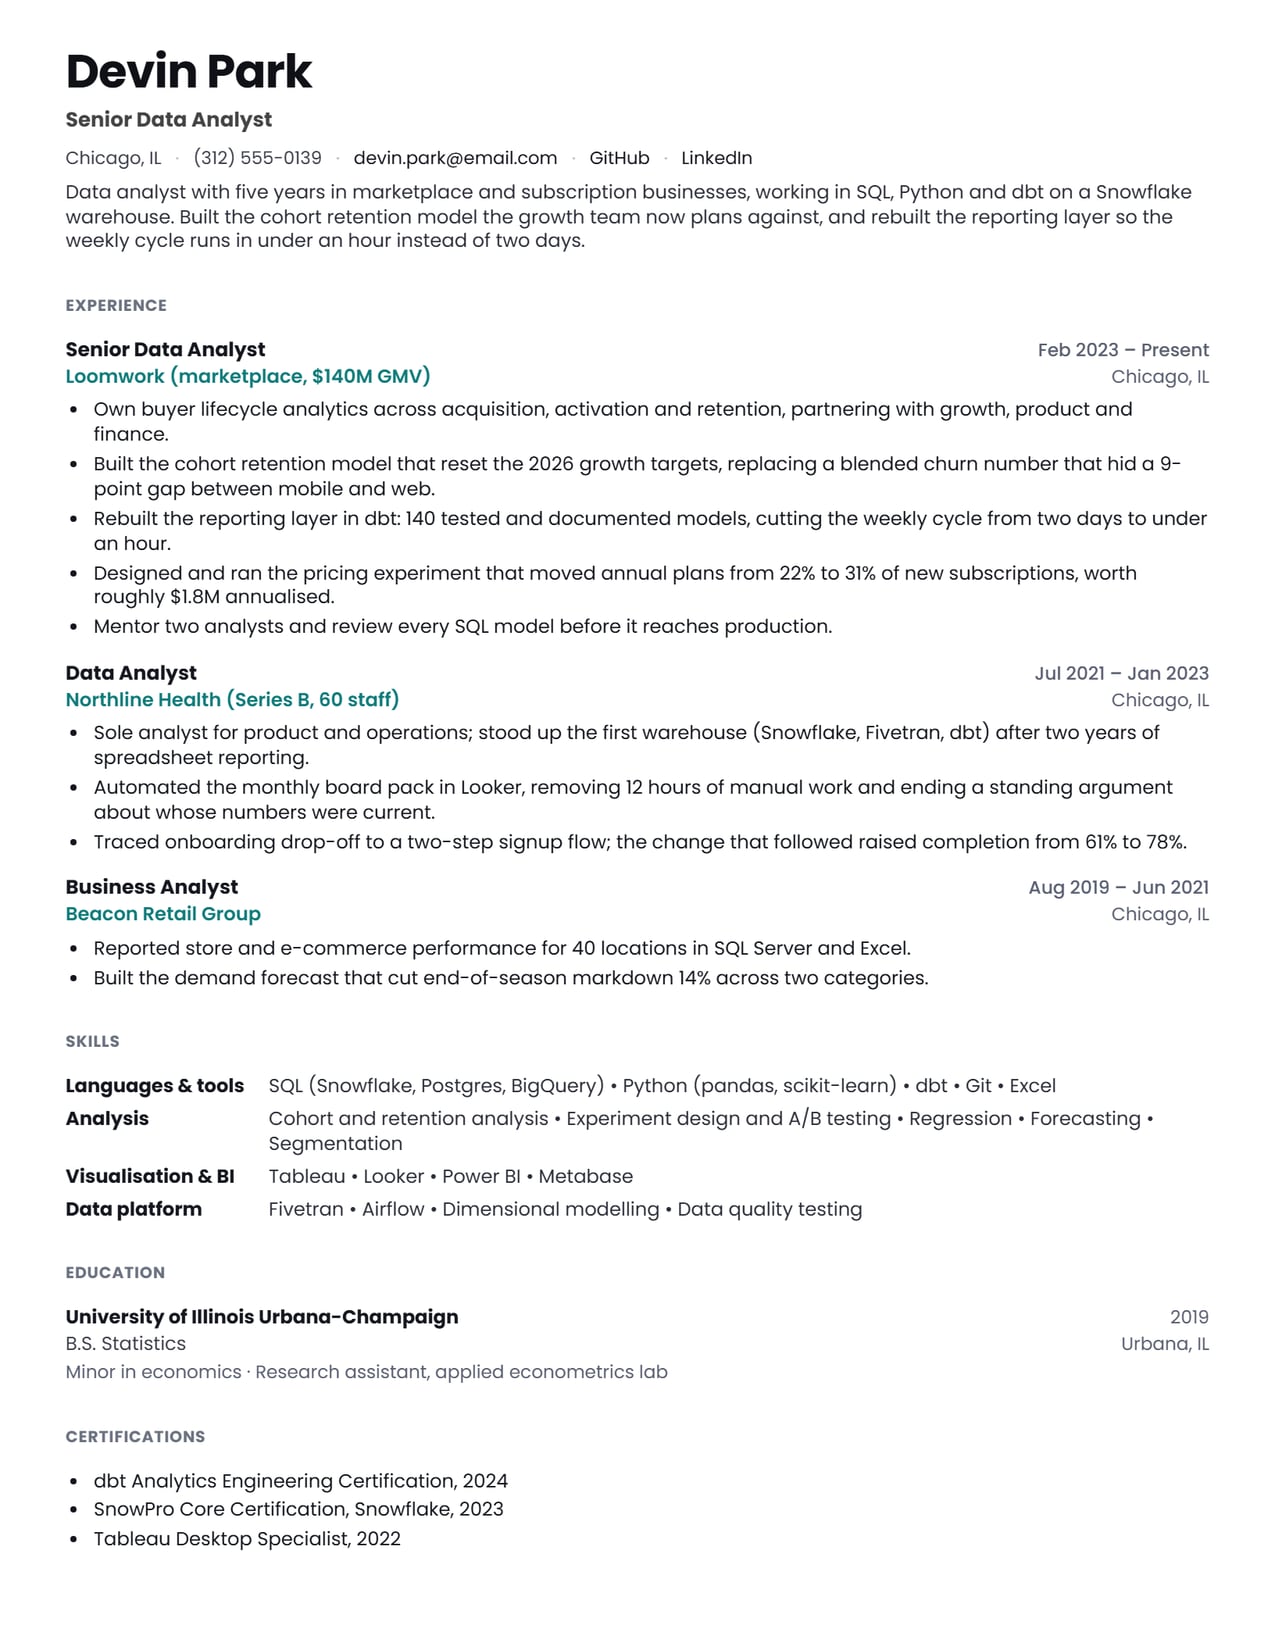
Devin Park, a senior data analyst in Chicago, five years in marketplace and subscription businesses
Five years across three companies on one page, with ten bullets and a full tool list. Read the experience bullets specifically: almost every one names an analysis and then says what happened because of it, which is the single habit that separates analytics resumes that get interviews from those that do not.
The annotations follow the page from the top.
Title line
"Senior Data Analyst" under the name. Analyst titles are inconsistent across companies, so this line tells the reader which ladder and which seniority band to compare you against before they read anything else.
Summary
Domain, stack and two results in three lines. "Marketplace and subscription businesses" is doing quiet work: it tells a hiring manager which metrics this person already understands, which is often the difference between a three-month ramp and a three-week one.
Links in the contact line
GitHub and LinkedIn sit where a reader looks for them. At five years in, the portfolio matters much less than it did at zero, but a live link still costs nothing and answers a question a recruiter might otherwise guess at.
The retention model bullet
The best line on the page. It names the artefact, then what it exposed, a 9-point gap between mobile and web that a blended churn number was hiding, and then the consequence: the growth targets were reset. Analysis, finding, decision. Most analyst bullets deliver only the first.
The dbt bullet
140 models, tested and documented, and a cycle that went from two days to under an hour. Naming dbt matters for the keyword match; the time saved matters because reporting toil is the cost every analytics manager is trying to cut.
The pricing experiment
Designed and ran, with the mix shift and a dollar figure. Note the hedge: "roughly $1.8M annualised". Analysts who attach precise revenue claims to experiments get taken apart in interviews; an honest approximation with a stated basis survives the question.
The mentoring line
Reviewing every SQL model before production is a seniority signal disguised as a duty. It says the team trusts this person's judgment on correctness, which is the thing a lead analyst is actually hired for.
The startup role
"Sole analyst" plus "stood up the first warehouse" is a strong pairing, because it shows scope and initiative in one line. The board pack bullet ends with a human detail, ending a standing argument about whose numbers were current, that any manager of an analytics function will recognise instantly.
Skills, grouped and specific
Four labelled groups, with the SQL dialects and the warehouse named in brackets. This is what survives a keyword filter: a system searching for Snowflake or Looker finds them as written, which "BI and database tools" never would.
Certifications, kept to three
dbt, SnowPro and Tableau, all for tools that appear in the experience above. Three certifications that match the work read as deliberate; twelve course certificates read as a substitute for it.
What is missing from the page
No mention of the stakeholders behind the work: how many teams, how requests arrived, whether there was a service model. At senior level that is worth a line, because managing demand is most of the job once the SQL stops being the hard part.
What an analytics hiring manager checks in the first four seconds
Analytics applications arrive in volume, and the first pass is fast and mechanical. Four questions, in roughly this order.
The "so what" problem
This is the single most common weakness in analytics resumes, and fixing it changes more than any formatting decision could. Analysts write about their output rather than about what their output caused, because the output is the part they controlled.
The fix is to write the whole chain: what you analysed, what it showed, and what somebody did about it. The third clause is where the value sits, and it is the one that gets left off.
Turn analytics duties into evidence: eight rewrites
Every analyst writes SQL, builds dashboards and answers stakeholder questions. Saying so describes the job title. What distinguishes you is the question you answered, what you found, and what the business did next.
Instead ofBuilt dashboards to track key business metrics.
WriteBuilt the cohort retention model that reset the 2026 growth targets, replacing a blended churn number that hid a 9-point gap between mobile and web.
Names what the old view got wrong and what the new one changed. A dashboard that changed a target is a different thing from a dashboard.
Instead ofWrote SQL queries to extract and analyse data.
WriteRebuilt the reporting layer in dbt: 140 tested and documented models, cutting the weekly cycle from two days to under an hour.
Volume, engineering practice and the time returned. Every analyst writes SQL, so the SQL itself is not the evidence.
Instead ofPerformed A/B testing to support product decisions.
WriteDesigned and ran the pricing experiment that moved annual plans from 22% to 31% of new subscriptions, worth roughly $1.8M annualised.
Names the metric, both endpoints and an honest approximation of the value.
Instead ofWorked with stakeholders to understand requirements.
WriteOwn buyer lifecycle analytics across acquisition, activation and retention, partnering with growth, product and finance.
Ownership and the specific teams. "Worked with stakeholders" is true of everyone who has ever had a job.
Instead ofCreated reports for senior management.
WriteAutomated the monthly board pack in Looker, removing 12 hours of manual work and ending a standing argument about whose numbers were current.
The second clause is the real outcome. A single trusted source is worth more to an executive team than the hours saved.
Instead ofAnalysed user behaviour data.
WriteTraced onboarding drop-off to a two-step signup flow; the change that followed raised completion from 61% to 78%.
The full chain in one sentence: analysis, finding, change, result with a baseline.
Instead ofMaintained data quality and integrity.
WriteAdded dbt tests across 140 models, cutting silent pipeline failures to near zero and catching three upstream schema changes before they reached a report.
Quality work is invisible until you describe what it prevented.
Instead ofAssisted with forecasting and planning.
WriteBuilt the demand forecast that cut end-of-season markdown 14% across two categories.
Forecasts are judged on the money they save, not on the method used to build them.
Analyst, analytics engineer, data scientist: which job are you applying for?
These titles overlap enough to be confusing and differ enough that applying to all three with one resume works for none of them. Decide which ladder you are on, then let the resume argue for that one.
| Role | Lead with | Also useful | Avoid leading with |
|---|---|---|---|
| Data analyst | Business questions answered, SQL depth, BI tool, stakeholder work | Domain knowledge, experiment analysis, reporting automation | Machine learning coursework |
| Analytics engineer | dbt, warehouse modelling, testing and documentation, pipeline ownership | Git workflow, CI, data contracts, SQL performance | Dashboard building alone |
| Data scientist | Modelling, experimentation, statistics, production deployment | Python depth, causal inference, ML systems | Reporting and BI work |
| BI developer / analyst | The BI platform in depth, semantic layer, report performance and governance | SQL, data modelling, training and enablement of users | Ad-hoc analysis narratives |
| Product analyst | Funnel, retention, activation and experiment work with a named product surface | Event tracking and instrumentation, product sense, A/B infrastructure | Finance-style reporting |
| Marketing analyst | Channel performance, attribution, CAC and LTV, campaign measurement | GA4, ad platforms, incrementality testing, CRM data | Generic dashboard lists |
| Financial / FP&A analyst | Forecasting, variance analysis, budget ownership, board reporting | Excel and modelling depth, systems, close-cycle familiarity | Machine learning |
| Healthcare / operations analyst | Domain constraints, regulated data handling, operational metrics moved | SQL, process work, cross-functional delivery | Consumer growth metrics |
| Career changer | Analysis done in your previous role, named tools, one strong public project | Transferable domain expertise, coursework with an applied output | A list of completed online courses |
| Senior / lead analyst | Ownership of an area, mentoring and review, demand management | Platform decisions, roadmap influence, hiring involvement | Individual query work |
The take-home and the SQL screen: what the resume has to set up
Almost every analytics process includes a technical stage, and the resume's job is to make that stage consistent with what you claimed. The fastest way to fail an analytics interview is to list something you cannot use under mild time pressure.
Portfolios: what helps, and what quietly hurts
Portfolios matter most when the work history is thin, and the wrong portfolio actively costs you interviews. Reviewers open one or two links, for about a minute each.
How analytics resumes get screened
Final checks before you apply
Keywords ATS looks for
Weave these into your resumewhere they’re true to your experience, and always mirror the exact wording from the specific job post you’re applying to.
Common mistakes to avoid
Data Analyst resume: FAQ
What should a data analyst resume include?
A title line, a three-line summary naming your domain and stack, links to work you would defend, experience where each bullet ends in a decision rather than an artefact, grouped skills naming tools exactly, education, and a short certification list. One page under five years, two beyond it.
How do I write data analyst bullets that stand out?
Finish the sentence. Analysis, then what it revealed, then what changed. "Traced onboarding drop-off to a two-step signup flow; the change that followed raised completion from 61% to 78%" works because the reader can see the chain. Most analyst bullets stop at the first clause.
Which skills should be on a data analyst resume?
SQL first, always, with the warehouse or dialect named. Then Python or R if you genuinely use them, your BI tool by name, spreadsheet depth, and the analysis methods you can defend: experiment design, cohort analysis, forecasting, regression. Add the modern data stack pieces you have touched, such as dbt, Fivetran or Airflow.
Do I need a portfolio for a data analyst job?
It helps most when your experience is thin and matters much less once you have two or three years of real work. One or two projects using messy public data with a written conclusion beat a dozen notebooks with no narrative. The question a portfolio has to answer is whether you can reach a defensible conclusion, not whether you can call a plotting library.
How is a data analyst resume different from a data scientist one?
An analyst resume is judged on business questions answered, SQL depth, stakeholder work and reporting infrastructure. A data scientist resume is judged on modelling, experimentation and production ML. There is overlap, but leading with the wrong half is why strong candidates get screened out of both.
How do I get a data analyst job with no experience?
Lead with the analysis you have actually done, wherever it happened: a reporting task in a non-analyst job, a capstone, a volunteer project for a small organisation. Name the tools honestly. Then make one project properly public, with the question, the data cleaning, the conclusion and its limitations written out. That last part is what separates candidates.
Should I put SQL queries or code on my resume?
No. Link a repository or a portfolio and keep the resume to what you did and what it changed. The technical assessment is a separate stage, and it is where code gets read.
How long should a data analyst resume be?
One page for the first five years or so, two once you have several roles and a meaningful platform history. Analytics hiring managers read fast and skim tools first, so density matters more than length: an underwritten two-page resume performs worse than a tight single page.